
Who is profiting from Israel’s genocidal campaign on the Middle East?
Blood Money is an online infographic resource
Providing
294 entities
609 facts
384 sources
$150.23 B money tracked, Oct 2023 to 2026
- US military aid to Israel, Oct 2023 to Sep 2026 $25.7B
- US regional operations and Gaza force funding for Israel, Oct 2023 to Sep 2026 $12.28B
- US war on Iran, 28 Feb to 3 Sep 2026 $43.6B
- US arms sales to Israel notified, Oct 2023 to Oct 2026 $39.68B
- European arms licences and exports to Israel, Oct 2023 to Jun 2026 $3.2B
- Israeli arms deals with European buyers, 2023 to Sep 2026 $25.49B
- United Democracy Project independent expenditures, 2024 cycle and 2026 cycle to 31 Aug 2026 $88.2M
- Donations to Friends of the IDF, 2024 $180.7M
Money tied to the genocide in Gaza, the destruction of South Lebanon and the war on Iran: aid, arms sales and licences, war spending and lobby money. Each flow counted once; stakes, company revenue and whole US military budgets are left out. Euro and pound figures converted at $1.16 per € and $1.34 per £.
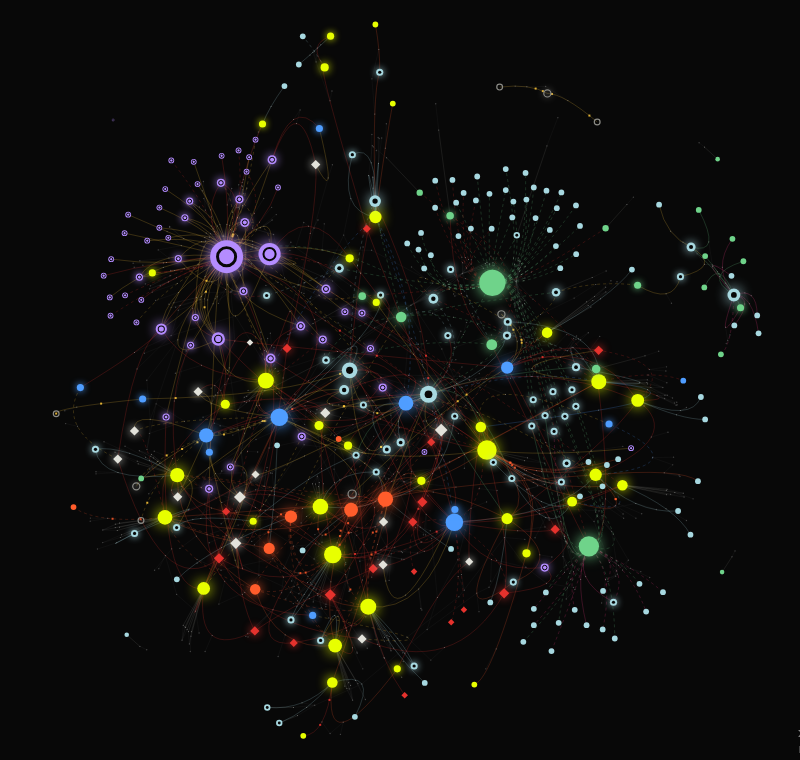
Every point is a record, coloured by type: weapons manufacturers and companies, asset managers, countries, governments, weapon systems, PACs and lobby groups and people. Lines are coloured by what connects them.
Solid lines are confirmed by a primary source such as a filing or official record (348). Dashed lines are reported by media or a data provider (169).
Open a case file on the left, or click any point. Click a figure on a line to see what it means and where it comes from. Press / to search.
How the facts are checked
Each fact in this database is tied to at least one document: a regulatory filing, an official record, a UN or court document, or a news investigation. The source is shown wherever the fact appears.
Confirmed by a primary source: an SEC filing, company report, government record or similar, with the quoted passage stored.
Reported: supported by media or a financial data provider. These stay visibly marked until a primary record is found.
Company-wide figures such as revenue or profit are shown for scale. Holdings by asset managers are held largely on behalf of clients, which does not make the profit any less real.
Enter Blood Money
Image: Screen shot from Blood Money mapping. Source: Blood Money.